Beehive scale build details. finally

Posted in attiny, avr, electronics, i make things on September 15, 2011 by makingthingswork

I’ve put this off for a while, but here’s all the details!

Summary: I made (and you probably can too!) a scale that is readable via USB with better than 1lb resolution for less than $50. I have been using it to track the weight of my beehive, and year-to-date, they have produced over 150lb of honey!

Long version (pictures/schematics/code near the bottom):
A while back, I hacked together a bathroom scale, instrumentation amp, and attiny85 to make a device that could weigh my beehive and report how much it weighed. It taught me a lot about electronics and bees, so i thought i’d share the details with everyone.

Surprisingly it was very inexpensive ($40-$50 US) for the parts, and has been working well for 9 months or so.

The project works as follows:

* An attiny85 (8 pin) is the brains of the operation, and uses the V-usb project to emulate USB. This is the interface to the computer. ~$3
* A standard bathroom scale is taken apart and wired up to the electronics, and placed under the hive. ~$25
* A 15′ usb cable has the end cut off of it, and is wired to the attiny. ~$5 (this is connected to the PC, for power and scale readings)
* A small fet used as a low-side switch turns the scale/amp on and off, to prevent it from warming up (probably not necessary), but also saves power ~$1
* an instrumentation amp (INA136 or INA138 i believe) amplifies the signal from the scale to the level where it can be read by the 10 bit ADC on the attiny. ~$6
* a fixed voltage divider (potentiometer) provides a reference for error compensation, and feeds into a different ADC channel ~$1
* when a read is requested, the attiny turns the fet on, waits a few seconds, then reads the scale and the voltage reference 32 times, and stores that data
* later, the results are read by the PC and graphed.

Weighing setup:
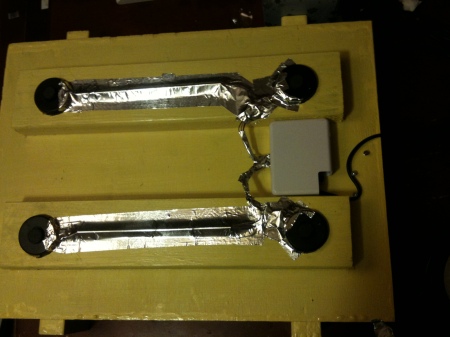
The scale is just a standard bathroom scale, which i removed the brains from and am using only the analog electronics… basically just the strain gauges and their attached wires.

The scale has a wiring harness which connects all the strain gauges, and terminates in 4 wires: E+, E-, S+, S-. E stands for ‘excitation’, and S stands for ‘sense’.

Apply a voltage difference across E+ and E- (eg 3V, 5V, or 10V), then read the voltage difference between S+ and S-. It’s very basic and quite simple. The main problem to solves is that the maximum difference between S+ and S- is about 6 mV, and needs to be amplified several hundred times to be usable on a 10-bit adc. The scale I got (cheapie on eBay) happened to report 6mV at the maximum reading, and go all the way down to 0mV as weight was added. I happened to get a little more resolution out of the scale by turning the gain up on the amp so that it read max ADC voltage at around 60lbs. Since the beehive will always weigh over 60lbs, this won’t impact my data at all and i get better resolution out of it.

Read some my other, older blog posts for more info, but i had to spend a long time calibrating the scale. the system has a /very/ strong temperature coefficient. I probably spend 5 weeks with the scale in the garage with between 45 and 90 lbs on it, trying to figure out how to get it to produce a flat reading.

In the end, I determined that the voltage swings were primarily due to the attiny, and by setting up a voltage divider to produce a fixed voltage, i was able to compensate for the fluctuations. With the current setup, i am able to get readings at about +/- .5 lb of accuracy, even though the resolution is much better than that. For the purposes of beekeeping, this is just fine. My next version will be much better, I hope :)

There are a few critical things i will do differently for my next scale (currently under design)
* get a really clean voltage source. The current model uses the 5v signal from the USB bus for power. This is a noisy signal, and may fluctuate with temperature (or it may be the voltage reference on the attiny). Any voltage fluctuation will alter the reading on the scale somewhat.
* I am also using the internal voltage reference on the attiny. This does not seem to be a good idea.
* don’t use the voltage reference or ADC on the attiny. It’s not good enough for precision work, at least in my experience. It also seems to have an affinity for even-numbered readings (eg binary numbers ending in 0).. so call it a 9bit ADC :)
* use an ADC with a low thermal coefficient, and/or built in voltage reference. I have been experimenting with a purpose-built chip from TI which is made to be a strain gauge ADC. It is 24bit and costs about the same as the instrumentation amp i used. So far it is working very well. This simplifies things somewhat.

Eagle files:
scale-no-vreg-2.sch
scale-no-vreg-2.brd

Code
hostcode.tar.gz libusb interface
tinycode.tar.gz attiny code

Some pictures:
Raw scale, showing strain gauges. Why yes, that is an old macbook power supply case
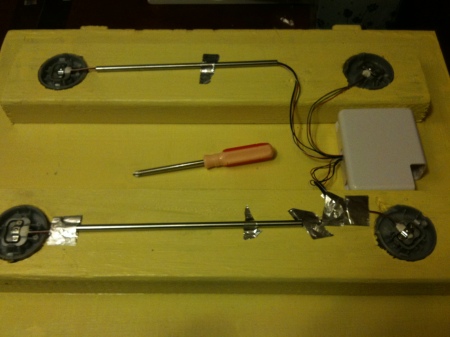
Ready for outdoor use

Scale is the yellow thing at the bottom of the hive.. sorry the picture is sideways

.. and some graphs:

Nice day in spring.. 5lb of weight (nectar/honey) gained
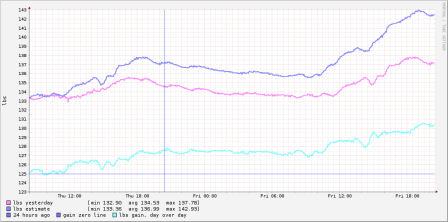
They made about 5lb of Honey that day

They swarmed.. 7lb of bees went out, 5lb of which were later recaptured
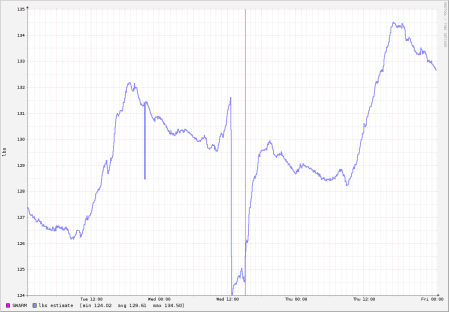
As of may, here’s a cleaned up graph of overall honey production

First stab with my DSO Quad – 12v dimmer experiments

Posted in DSO Quad, electronics on July 20, 2011 by makingthingswork

In our living room we have some ikea cable lights and we replaced their transformer based driver with a switching one.. I forget what model it is but it looks a lot like a laptop power brick. Anyways, we’ve had it for years, but i always got the feeling that it wasn’t as bright as it should be.

I just got a Digital storage oscilliscope, so I decided to take a look and see what the deal was.

In this case i knew the RMS voltage is 12v, which is a peak-to-peak voltage of around 35v. I checked, and my scope can handle up to 80v.

There are 2 main components to the lighting system:
* wall dimmer, which is an insteon 6 button keypad
* 12v driver, which is up in the attic and takes the 120v from the switch and drives 12v to the lights.

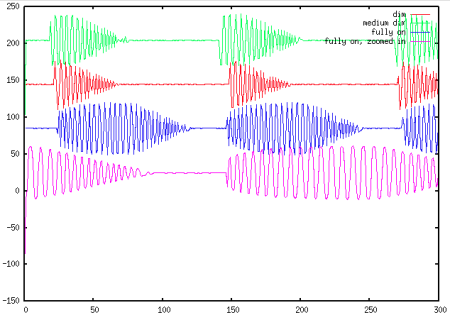
I am pretty sure the wall dimmer is the kind that chops the AC waveform at the leading edge, so i expected to see the waveform in the scope be sort of a truncated SIN wave.

What i saw when i started was a truncated sin wave, but it also itself was made up of a nice sin wave. That must be a function of the 12v controller. Curious indeed.

As i increased the brightness, the overall sin shape returned almost all the way, but the sub-wave remained. The main sin wave never became fully ‘on’.. I think this is caused by the wall-dimmer i have.

check out the traces:

The last trace is zoomed in more than the previous 3.

More error correction, aka the attiny reference voltage sucks.

Posted in attiny, avr, electronics on February 9, 2011 by makingthingswork

After much curve fitting and data analysis, I decided that the fluctuations in the readings were too much, and i had to find another way of fixing things.

I had previously made up my mind that the attiny board i made was the source of the error, not the scale itself. After working on it one evening, I saw the readings move quickly, then stabilize after i put the unit back in the garage (in the cold) from the nice warm house. The scale stayed out there the whole time.

So i figured it was the resistors changing and affecting the gain on the amplifier.

I ran some calculations and determined that the gain should not have changed anywhere near what it did in reaction to the temperature fluctuations, and the changes in resistance that might bring. So that leaves one thing: the ADC unit on the attiny85 itself.

I have been using the 1.1V reference voltage on the attiny as the basis for the readings. It’s a ‘bandgap’ based thing, which sounds fancy and accurate, but let’s give it a test. To test it, i got a 5k potentiometer and put the end pins on +5v and GND, and the wiper was set so it read about 1 volt. I connected the 1volt output to a spare pin on the attiny, and started taking readings to see if it would exhibit the same pattern as the scale.

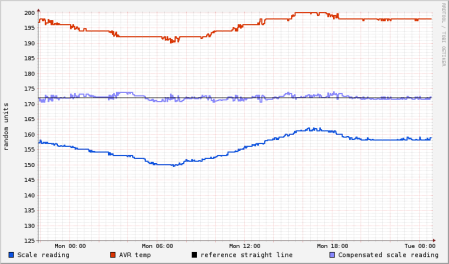
About a day later, i’m pleased to report that the constant voltage varies EXACTLY the same way the scale does.

Here’s a picture:

After some analysis and curve-fitting, the coefficient is -1.0, which means that the error in the voltage reading is exactly the same as the scale reading, just opposite (which is to be expected, since i am storing the scale reading as 1024 – raw_reading). So it’s basically a matter of adding them together then subtracting an offset.

As you can see, it works really well, and the total range is just 2 ticks!

Also note that I was able to use a potentiometer (could easily have been 2 resistors) as a MUCH more effective temperature sensor than the internal temperature sensor of the attiny itself. That is somewhat sad.

For extra accuracy, i may someday try using an external VREF input, and see if it’s the ADC itself or if it’s the bandgap voltage moving around. For now, this is good enough.

More useful curve fitting – temperature compensation

Posted in Linux, math is fun on February 1, 2011 by makingthingswork

One of my current projects involves making a USB bathroom scale (I’ll post details later).

So as part of the process, I’ve been collecting the data and graphing it to make sure it gives a stable reading. It’s currently sitting in the garage with a 30lb bag of concrete on it, and the readings are not stable — they vary with temperature. Good to know, but how to fix it?

Here’s a day’s worth of data:

Since the weight is constant, the only variation (i’m assuming) is due to the fluctuations in temperature. It looks like a pretty close correlation. OK so far so good.

I exported the datapoints into a text file, looking like this:

258 158
258 157.269
258 157
...

Then loaded up gnuplot.

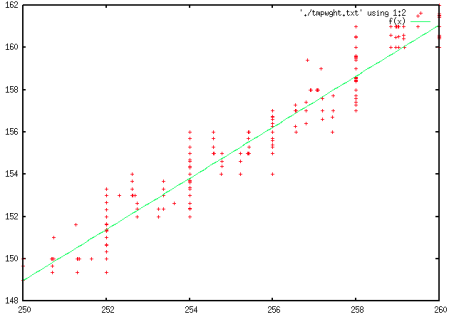
First I plotted them against each other, to see if there was a strong linear correlation

gnuplot> plot './tmpwght.txt' using 1:2 with points

It seems pretty linear.. (see the combined graph below). The temperature sensor in the attiny85 has only 1C increments, and the datapoints seem to land on ‘even’ numbers more often than not, creating groups of vertical points on the graph.

I then need to find the slope of the line that best fits the curve. I’m expecting a straight line of best fit, eg y=mx+b style, so i feed that into gnuplot’s “FIT” routines


gnuplot> f(x)=a*x+b
gnuplot> fit f(x) './tmpwght.txt' via a,b
....
Final set of parameters
a = 1.20761
b = -152.923

so it appears theres about a 1.2:1 correlation between temperature and weight reading (‘a’ from the curve fit). Let’s check the graph

gnuplot> f(x)=a*x+b
gnuplot> a=1.20761
gnuplot> b=-152.923
gnuplot> plot './tmpwght.txt' using 1:2 with points, f(x)

The fit looks good enough to try out. Let’s see if it does what we want.

Now, to adjust the weight reading to compensate for temperature fluctuations.

Since the ratio is based on the raw reading of temperature, we need to multiply the 2 together before we do any shifting: 1.20761 * temperature. Then, we need to make the temperature reading move the opposite way, so when the temp goes up, the number goes down. This is done by subtracting it from another number. I picked 325. This should give us a value that exactly contradicts the effect the temperature had on the weight measurement.

In equation form:
offset = 325 - (1.20761 * temperature)

Then we add that offset to the weight measurement, and we should get a straight line. Let’s see:

Looks pretty straight to me. The parts that aren’t straight can probably be attributed to poor temperature sensor data, which i will try and fix, either by adding a better temp sensor, or polling more frequently and averaging results.

I like math

Single pin relay control

Posted in electronics, i make things on January 16, 2011 by makingthingswork

EDIT: The below schematic and circuit description are slightly incorrect – the PNP and NPN transistors should be reversed.

I am cheap when it comes to micro-controller pins. I don’t like using them if i don’t have to. I also don’t like throwing current around unnecessarily.

I was working on a project which i wanted to control a bunch of relays with my micro-controller, but didn’t want to dedicate 2 pins or an h-bridge to each relay driver. My relays were fairly small, and i came up with the following way to control them with a single (tri-state) pin, and some external components.

If you have a strong-ish pin driver or a low-current relay coil, you don’t even need the totem pole arrangement.

Background:

Relays work by putting a certain amount of current through an inductor, setting up a magnetic field that pushes a switch. A normal relay requires that current to be always on. Once you stop feeding it, it goes back to ‘off’ (or on, whatever the default is).  A Latching relay doesn’t have the spring or whatever to force the switch back once current is released. It acts more like a light-switch.

So, for a latching relay you need to supply a certain amount of current to get it to switch, then another amount in reverse to get it to switch back.

Relays usually specify the current needed to switch them, and the internal resistance of the coils.

The idea:

Use a latching relay with a capacitor behind it, sized such that it can store enough current to switch the relay back:

control-pin -> relay coil -> capacitor -> GND

you send 5v or whatever though the coil and the capacitor will start to charge up. That current is enough to switch the relay, so it turns on. As you leave the pin high, the cap will charge up and the current will drop off to zero. Once you are ready to unswitch the relay, connect the pin to ground, and the cap will discharge across the coil and switch the relay back.

If you have a big relay, small pin driver, etc you can add a NPN and PNP transistor pair in a ‘totem pole’ configuration to switch a larger amount of current.

Bingo! one pin, no excess current loss, and 1 (or 3) extra components.

Here’s a picture:

The switch at left simulates the microcontroller pin. The resistor and inductor simulate the coil of the relay.

Want to try it? here’s the falstad simulator code (See this link for how)

$ 1 5.0E-6 31.41906602856942 54 5.0 50
c 304 208 304 256 0 9.999999999999999E-5 4.4916891133897625
g 304 256 304 288 0
w 240 112 304 112 0
t 208 96 240 96 0 1 0.0 0.5013938559564375 100.0
S 176 112 128 112 0 1 false 0
t 176 128 240 128 0 -1 5.0 0.5013938559564375 100.0
R 128 96 96 96 0 0 40.0 5.0 0.0 0.0 0.5
w 176 128 176 112 0
w 176 112 176 96 0
w 176 96 208 96 0
R 240 80 240 48 0 0 40.0 5.0 0.0 0.0 0.5
g 240 144 240 176 0
r 304 112 304 160 0 135.0
l 304 160 304 208 0 0.01 5.129834965258037E-5
g 112 128 112 144 0
w 112 128 128 128 0
x 61 75 155 79 0 18 control pin
x 251 77 360 81 0 18 “totem pole”
x 347 190 424 194 0 18 relay coil
o 12 64 0 291 2.5 0.025 0 -1

Depending on the control voltage, you may need to add more resistance inline with the coil.

low-fi circuit simulation

Posted in electronics, i make things on January 16, 2011 by makingthingswork

I often want to play with some circuit or other, and am not sure if it will work.

For those of us who aren’t super strong on electronics theory, this means either we buy a bunch of parts and test it out, possibly frying them, etc OR do some sort of simulator. Unfortunately most simulators are somewhat complex (spice, etc)

I was pointed to a really nice java simulator that is online for free:
http://www.falstad.com/circuit/e-index.html

He has lots of examples, and you can edit the circuits yourself, add parts etc. I have learned a lot there.

For example, here’s how to simulate my DC motor speed control circuit:
1) go to http://www.falstad.com/circuit/e-ohms.html
2) right click in the black after java loads, and select file->import
3) paste in the following:

$ 1 5.0E-6 3.9121283998153213 53 5.0 50
R 112 224 64 224 0 2 400.0 2.5 2.5 0.0 0.5
g 320 256 320 272 0
d 208 128 208 192 1 0.3
t 176 112 208 112 0 1 -11.855891688647894 -0.016674669651078056 100.0
w 176 160 176 112 0
w 176 112 176 96 0
r 176 96 176 48 0 1200.0
R 176 48 128 48 0 0 40.0 12.0 0.0 0.0 0.5
w 176 48 208 48 0
w 208 48 208 96 0
w 208 128 272 128 0
f 272 128 320 128 0 1.5
w 320 144 320 256 0
w 208 48 320 48 0
f 176 224 208 224 0 1.5
l 320 112 320 48 0 4.0E-5 7.833859394512643E-8
w 320 48 384 48 0
w 320 112 384 112 0
d 384 112 384 48 1 0.805904783
r 384 48 432 48 0 2700.0
w 384 112 432 112 0
d 432 48 432 112 1 0.805904783
x 447 73 480 77 0 18 LED
x 266 167 355 171 0 18 Power FET
x 255 86 308 90 0 18 motor
I 112 224 160 224 0 0.5
w 160 224 176 224 0
x 7 260 111 264 0 18 PWM source
w 176 160 176 192 0
w 176 192 208 192 0
w 208 192 208 208 0
g 208 240 208 272 0
x 62 119 155 123 0 18 gate driver
x 345 136 470 140 0 18 flywheel diode

that’s it! pretty neat, huh?

You can easily make your own by doing file->import with a blank value, then right-click and add parts as you like. File->export will show the config you should save as a txt file if you want to save the circuit or come back later.

You can also copy the java class locally and run it without an internet connection. He updates it from time to time, so check back for new parts and features.

He also has some physics simulators which i haven’t tried, but are probably good, given the high-quality of his electronics site.

curve fitting and graphing.

Posted in Linux, solar on January 16, 2011 by makingthingswork

Here’s how i do the curve fits and resulting graphing.

I use the free program ‘gnuplot’ which is pretty powerful, can do curve-fits, and graph everything.

Steps:

1: measure your curve and get some points. I created a file called ‘measured.dat’:

0  .0044
.1 .0123
.2 .0218
.3 .0382
.4 .0636
.5 .098
.6 .157
.7 .221
.8 .300
.9 .404
1 .495

2)  fit the curve. I use a cubic parabola: Ax3+Bx2+Cx+D

shell$ gnuplot
...
gnuplot> f(x)=a*x*x*x+b*x*x+c*x+d
gnuplot> fit f(x) './measured.dat' via a,b,c,d
...
Final set of parameters            Asymptotic Standard Error
=======================            ==========================a               = 0.142852         +/- 0.07749      (54.25%)
b               = 0.385536         +/- 0.1181       (30.63%)
c               = -0.035066        +/- 0.0493       (140.6%)
d               = 0.00833846       +/- 0.005414     (64.93%)
So now you have your coefficients: a,b,c,d

3) plug them into a graphing file. here’s mine:

# let's call this file "fit.gnuplot"
# you can keep the body of the file the same, and just
# modify a,b,c,d each time you run a new curve
a=0.142852
b=0.385536
c=-0.035066
d=0.00833846

#Cubic Parabola
#C=ax3 + bx2 + cx + d
B(x)=a*x**3+b*x**2+c*x+d
# this trick limits the curve to x=0 through x=1.05
C(x)= (x>0 && x<1.05) ? B(x) : 1/0

# tangent slope, derivative of cantilever
# D = B'=3ax2 + 2bx + c
D(x)=3*a*x**2+2*b*x+c

#focus (reflected) line slope (ts = tangent slope)
# y = 1/(TAN(2*(ATAN(1/ts))))
# incidence angle (0 = directly above,
#                  + means low in the sky
#                  - means high in the sky

# radians = degrees x PI / 180
# precalculate one, just showing the formula, not used
ideg= 0;
irad = ideg*pi/180

## slope of reflected ray
F(ts)=1/tan(2*atan(1/ts)-irad)
# focus y-int
G(tp)=C(tp)-(tp*F(D(tp)))

## where will the graph be drawn?
set xrange [-.5:1.2]
set yrange [-.1:1.2]

## setup graphing
set multiplot
# offset (first ray will be ioff+istep)
ioff=-3
istep=1.5
# each ray will offset on x axis by this much
xstep=.1
# arrow number
ar=0
# tangent point
tp=0
ideg=ioff
irad = ideg*pi/180

## how far to the left of the x-axis to extend arrows?
xp = -.35

## increment various counters
ar=ar+1; tp=tp+xstep

## downward ray
set arrow ar from tp,5 to tp,C(tp) lt rgb 'black'

## normal reflected ray
ideg=ideg+istep; irad = ideg*pi/180; ar=ar+1;
set arrow ar from tp,C(tp) to xp,F(D(tp))*xp+G(tp) lt rgb 'red'

## plus 1 step
ideg=ideg+istep; irad = ideg*pi/180; ar=ar+1;
set arrow ar from tp,C(tp) to xp,F(D(tp))*xp+G(tp) lt rgb 'black'

## plus another step
ideg=ideg+istep; irad = ideg*pi/180; ar=ar+1;
set arrow ar from tp,C(tp) to xp,F(D(tp))*xp+G(tp) lt rgb 'green'

## repeat this stanza as many times as you need
## next set
ideg=ioff; irad = ideg*pi/180
ar=ar+1; tp=tp+xstep
set arrow ar from tp,5 to tp,C(tp)  lt rgb 'black'   
ideg=ideg+istep; irad = ideg*pi/180; ar=ar+1;
set arrow ar from tp,C(tp) to xp,F(D(tp))*xp+G(tp) lt rgb 'red'
ideg=ideg+istep; irad = ideg*pi/180; ar=ar+1;
set arrow ar from tp,C(tp) to xp,F(D(tp))*xp+G(tp) lt rgb 'black'
ideg=ideg+istep; irad = ideg*pi/180; ar=ar+1;
set arrow ar from tp,C(tp) to xp,F(D(tp))*xp+G(tp) lt rgb 'green'

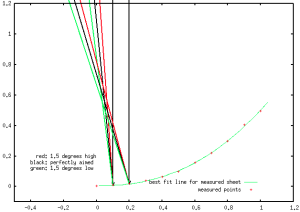
set label "  red: 1.5 degrees high\nblack: perfectly aimed\ngreen: 1.5 degrees low" at -.4,.2

set key at 1,.05
plot C(x) lt 2 title 'best fit line for measured sheet'
set key at 1,0
plot 'measured.dat' with points title 'measured points'

unset multiplot
pause -1

Now you have a graph definition that will do all the fancy arrows and such.

4) Show the graph:

shell$ gnuplot fit.gnuplot

Here’s what it makes:

You’ll need to duplicate the ‘repeat this stanza’ section once more for each point without a reflection on it.

Concetrating parabolic trough – part 1

Posted in i make things, solar on January 16, 2011 by makingthingswork

I’ve been looking into solar for water heating and (less so) power generation. I’ve decided that i like concentrating collectors since there’s less to insulate.

I did some tests and decided that while a parabolic collector is great, you can make a ‘good enough’ collector with far less precise construction techniques. I like that. I’m terrible at making things accurately, especially when they can be subjected to nature, and made from wood or other materials (not necessarily straight).

I’m a big fan of ‘coroplast’, aka corrugated plastic sheet. It costs about $15 for a 4×8 sheet of the stuff and it has some great qualities. Most of it is polypropylene, and can be heat welded if that’s what you’re after.

The concept is like this:

Take a piece of wood and attach some plastic sheet to it on one side.

Build a riser about 3′ out and put a pipe or other support on it, which will force the plastic sheet up into a bent shape.

Build an insulated collection mechanism on the top.

This has several key benefits:

  • Small surface to collect. Small surface means less materials and less surface to lose heat from
  • Insulation above collector. Convection is the dominant heat loss mechanism in these collectors, and by keeping all the hot air below insulation, you will lose a lot less
  • ease of construction. Not much to it at all

The main drawback is that you will have to aim it periodically. Thats another post.

After reading some engineering pages, i learned that a cantilever subjected to a strain at the end of it (like proposed above) will form a parabola-like shape. This is apparently well known in amateur radio circles as a ‘stressed parabola’. To get a good focus, you need a long focal length. For solar heat, i think you can get by with a looser focus.

I figured out the math to calculate the focus points for this kind of curve, and within a 10degree arc of aiming (eg if 0 deg is aimed directly at the sun, a +/- 5 deg range) it focuses all the light at a 7-8″ wide spot about 18″ off the origin point (eg x=0,y=0)

So i did a ton of calculations, sought some feedback, and was told it wouldn’t work. So i built a little one. I took a 2×4 piece of coroplast and leaned it on a char, then measured the height every 10 cm. I then did a curve-fit and plotted the focus. It was not anywhere near the same equation as was predicted by the engineering data i had, but the curve fit was spot on just the same, and it gave a 6″ focus! That’s great.

I then built a rig which would be a little more like what i would actually use:

The plastic is attached at 3 points: base, about 1/3 and at the top. It was minimally forced into place, but the middle support was pushed down a little, and i attached them in this order: bottom, middle, top. I should have fixed the top and bottom then attached the middle as ‘insurance’. As you will see later, forcing the middle throws off the curve-fit.

Basic theory:

Every point on a curve has a tangent line, which is the line that just ‘kisses’ the curve at that spot. When a ray of light hits the curve, it will reflect as if it had ‘bounced’ off the tangent line.

The Tangent can be calculated as the derivative of the curve, which is basic Calculus, but isn’t really very difficult to do.

So, to calculate the reflection slope, you do this:

F(ts)=1/tan(2*atan(1/ts)-irad)

ts is the tangent slope. irad is the offset of the inbound ray from vertical in radians.

You can then calculate the y-intercept of the line, and plot it.

Here are some graphs:

The colored lines should show ‘inbound’ (eg top to curve), but i didn’t plot them backwards. Too lazy.

This graph shows where the focus of the reflections would be. As you can see, it’s a pretty tight focus, however the curve does not match as well for this setup, so will need experimental verification.

I should note that the plastic will be coated with some sort of reflective coating (reflective mylar, etc)

PWM DC Motor control circuit

Posted in electronics, i make things on January 16, 2011 by makingthingswork

I’ve decided to start posting some of my makings again. Not sure what it is about January, but here we are.

I picked up a few 12v DC motors with the idea of making a variable speed controller for them. DC motors lend themselves to it, by doing PWM and/or lowering the voltage. I may eventually make a variable voltage driver, but in my experiments, PWM works better, since the higher voltage puts more current and therefore more torque while it’s on.

Here’s the circuit:

This circuit switches ground on/off. The motor/pump should be connected to the +voltage , and the motor ground to the MGND line. Should work with just about any input voltage. I’ve used it at +5 and +12v. Different voltage will need different values for R3, if you have an LED.

The output is out-of-phase with the PWM input. The PWM fet should be a fast switching type, and the other FET should be a power FET. I used IRFZ34N for the power fet, and VN1304 for the switching FET (ignore the part # in the schematic, that was just to get the correct pinout)

Quick description:

R1, Q3, D1, Q2 form a gate driver circuit for the Power FET. When the PWM pulses high, the power fet is turned off. This means the motor is out of phase (opposite) with the PWM input

R1 prevents too much power from going from +12v to GND when the gate is pulled low

D2 is a flywheel diode, to contain any back EMF generated by the motor.

R3, LED1 are just an indicator, and is optional. R3 just sets the current on the LED.

C1 is optional and may smooth the PWM signal out, if desired.

C2 will smooth out the load on the power source. Recommended to keep it.

I have tested this on 12v motors, and it works great! I do recommend a heatsink on the power fet.

I used an arduino to drive a PWM pulse, and used a potentiometer to vary the speed.

why?

Posted in Uncategorized on January 21, 2008 by makingthingswork

I spend a lot of time with technology, and usually things don’t work exactly right the first time.

I glean a lot of info off the web in various places in the process of getting things back in the ‘working’ category, and I figure I should give as well as I get.

So here we go.  I hope it helps.